Hi Friends,
Today I want to share with you a very useful feature of MS Excel (i.e. PivotTable).
In Microsoft Excel, you can pivot data in a PivotTable or PivotChart report by changing the field layout of the data. By using the PivotTable Field List, you can add, rearrange, or remove fields to show data in a PivotTable or PivotChart exactly the way that you want.
Here, I am showing you, how to create, arrange and manipulate the PivotTable with a simple example:–
Step 1:-
Suppose we have records of three teams(ie. A, B, and C), which contained records of their Wins and lose matches. We have to find out several wins and lose fields of the three teams. First of all, create a simple table as below:-
Step 2:- Then go to the Insert tab and select PivotTable and click on it:-
Step 3:- Select three columns as per the below jpeg:-
Also read:- How to Find Duplicate or Unique Value in Excel with Conditional Formatting
Step 4:- After selecting columns, then click on OK and follow the below step:-
It will display a small window on the right side of the screen. You have to select all checkboxes and drag the count of Win and the count of Loose under the value box as per the above jpeg. It will display the count of wins and lost matches. If you want to know the sum of the matches, we have to move on to our next step.
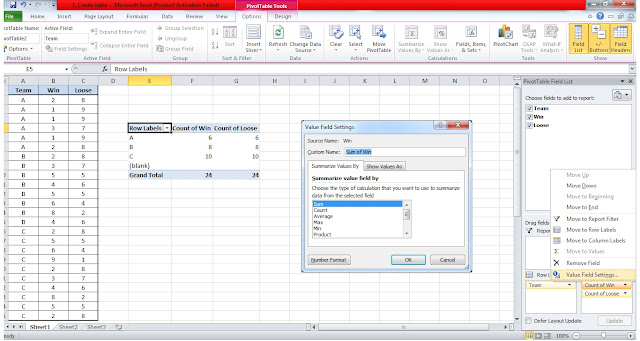
Step 5:- To put out the sum of the total matches, you have to just click on the count of Win and count or lose.
Select the Value field setting and then click on sum and hit enter. You can find out the average, Max, or Min as well.
At last, we found that the sum of the total win and loose matches will be displayed as follows:-
It is a simple example to understand the working of PivotTable. You can summarize the table as per your requirement.
For get such types of knowledgeable things keep visiting IT KEEDA
Stay blessed 🙂


